
By, Pawan Nayar
One of the biggest challenges that modern technical communicators face is making the transition from expert content creators to enablers of successful content consumption, which leads to user success and customer satisfaction. Gone are the days of creating reams of content with two feeder lines: engineering and technical/customer support. Consumption metrics are now defining what content to invest in, how to invest, and how to measure success on that investment. This approach is especially important today when most technical content teams handle a large inventory of active content that’s multi-locale and multi-version. Plus, most content teams today have mounting pressures to generate the maximum return on investment with forever-sparse critical resources.
At a time when disappointment travels at the speed of a tweet, responsive, agile, and analytics-based, structured investments are key to any department’s or firm’s success. A content-creating organization’s dexterity is now tied to systematic customer satisfaction improvements—while still managing regular content updates for changed or improved products. This article looks at the changing content world and the pressures that technical communicators face today. It also outlines structured possibilities for technical communicators to up their value in their organization through analytics-driven content optimization.
The Times They Are A-Changin’
Technical communication, as a career, has been around for a few decades. However, it established itself in the way we know it now only in the 1990s and early 2000s. The DTP revolution saw books going digital; the PDFs soon became the norm – ubiquitous as they say. Next, the rise of the Internet made HTML the favored format for content. Over the years, we saw that popular content organizational mechanisms of the book world, like glossary, ToC, and index, made way for hub pages, related links, and search optimization. Through the years 2010 to 2013, the world changed again. The rise of Facebook made social not just acceptable but cool, and soon social went enterprise. Twitter changed the content amplification and influence game. Google became the default entry and exit page of the user’s content consumption experience, besides becoming a spontaneous substitute for the verb ‘search’. Mobiles became the first point of connection. Devices evolved. PCs and servers soon lost out to the cloud.

Some New Challenges, Some Super-New Opportunities!
- Search is winning over navigation. Navigation, however, is still important.
- Rich text is winning over text. Pure text and pure video often lose in the long run.
- Workflow and solution-centric documentation is winning over feature-based documentation.
- Official content is being supplemented with community content (forums, YouTube, partners, publishers, and influencers). Firms are trying innovative ways to get user feedback, encourage power user contributions, and help connect users with like-minded users.
- Official content about a release is being developed with agility and made available on the ship date. More immersive content—including workflows, tutorials, and examples—is provided after the ship date.
- More pages are being read, but less time is spent on pages. Users sample pages and make fast judgments. They stick to a page only when they need it.
- 5-7% of top content may attract 80-90% of the top views.
- Mobile content delivery starts with responsive HTMLs served in a browser, but a true mobile experience is consuming content delivered through Android or iOS mobile apps.
- In-context tips and best practices need personalizing. There is an opportunity to treat each user as a customer segment. Each user needs to be served in the context of where she is, what she is doing, and what she can achieve vis-à-vis her goals.
- What new users want, power users often do not care about. A balanced mix of getting started, training, basic videos, and complex marquee feature content is important. For beginners to be successful, they need to accomplish their goals soon enough or they will lose their patience and fail. So give new users a guidance on how and where to begin. Frame initial customer interactions around the “task in mind” and “just exploring” mindsets.
- Engagement and interactivity is becoming integral to a user experience. Users can try tasks with a product in a simulated environment. Users can follow multiple learning paths to learn a product, and then test their learning by opting for an online certification, even mini-certification!
Balancing Investment Using Analytics
At a time when resources are scarce, it is difficult to expect significantly more budget to create, publish, deliver, analyze, and improve content. A structured balance is the answer.
Coordination is key
At an organizational level, it is important to coordinate content creation goals and strategies of the various content-producing entities in the firm: technical publications, marcom, training, evangelization, community management, knowledge management, and branding. While the broader technical publications team can continue to create structured content for “run the business” work, it needs to integrate high-quality samples, assets, best practices, training content, and expert community content from all available sources. Redundancies in planning are best avoided. If all arms of an organization look at the same source of analytics-driven truth, the system as a whole gains maximum efficiency and produces the optimum solution.

Analytics is the major feed train to systematic planning
It is time to plan at a department level, BU or team level, project level, and individual level.
- A department-level plan will include major initiatives that improve navigation, search, customer satisfaction, contextual help, community support, and publishing efficiencies.
- Team-level plans should be optimized across major releases.
- Project-level plans need to balance department-level plans.
- BU-team-level should have plans on Release to Business (task-changes, workflow-changes, feature-changes, on-boarding, user enablement). These teams should also use analytics-based approach to plan the key improvement in top 10-15% content that brings in 70-90% of the views, feedback, search, recall, and DSAT (Documentation SATisfaction).
- Individual plans can be optimized based on team size, BU release timeframe, expertise, and bandwidth of individuals.
Analytics should aid in smarter consumption
Each content team must have a handle on all types of analytics that can help improve content in structured ways. This set of analytics includes data on page views, user-searched terms, consumption “heat maps” on important pages, referral traffic, and user feedback including ratings, verbatim, and feedback. Insights from analytics should be supplemented with product usage patterns that identify most-used features, time spent on the features, frequent error messages, user disappointments, and so on. Analytics-driven data should be supplemented with qualitative data coming from technical support, technical consulting, product management, beta users, partners, system integrators, forums, and the web at large. The sum total of this data should be used in optimizing the top 10% articles that have 80% impact on customer success. More than identifying the articles to fix, analytics should be used to capture all legitimate issues to fix and then fix or improve the desired articles.
Analytics should seed experimentation and fixes
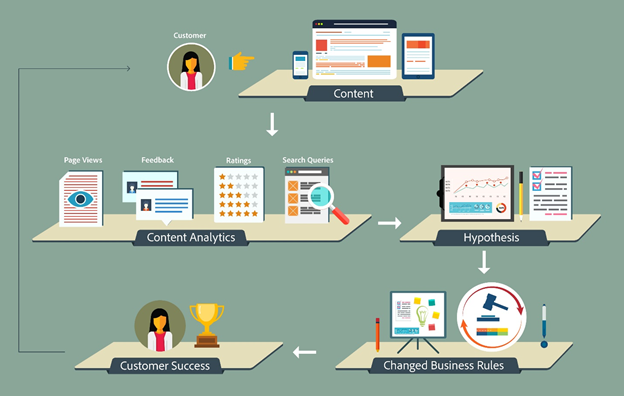
Analytics should help content creators build hypotheses and perform A/B testing. Enclosed are some questions that can help you formulate your hypotheses:
- Rich text: Is a video better than an illustration – when and where? How much text-visual balance should you have in an article? Where should you use a hero image that inspires versus a specific workflow that aids successful content consumption? Should you use an image or a video?
- User journey and clickmap: Should you have four links or seven? What should be the page size? Which part of a long article should actually be a different article? Which links should be above the scroll fold and which below the fold? Which should be the first article of a collection of related articles, and why?
- Size: Should average page size change with user profile? Where do you need context-sensitive help?
- Globalization: What content should be localized? What content should be localized sim-ship and what can come after the English content has gone live? What content needs to be amplified for users of a specific locale?
- User profiling and consumption aids: Which articles need detailed visual examples? Which concepts require visual explanations? What is a simple concept and should not be over-documented? What user language should be used in article headings?
- Media: What is most required – HTML or PDF? What content is mostly consumed on mobile devices?
- Click-through rate (CTR): Which article titles or SEO descriptions are closest to user asks and have maximum CTR?
Analytics is an alternate Subject Matter Expert (SME) that can support technical communicators
It is not easy to improve existing content, especially when you’ve been working on it for a while. Analytics offers you fresh perspectives of the same content. Here are some ideas:
- Use search word analysis to identify winning words for topic titles, SEO descriptions, content above the page scroll fold, major sections, and Alt-text attribute values for images.
- Analyze user feedback on content, search terms, and top-used phrases in technical/customer support voice-chat transaction to identify user lingo and user asks.
- Build examples, use cases, and alternate explanations around user comments.
- Identify problems that customers voice on forums and high-frequency calls in technical support to identify technical doc and FAQ candidates, and notes/cautions/tips in the content.
- Further, analyze error messages and use the insight for structured improvement of text strings in product error messages.
- Look at frequently used verbs and nouns in customer vocabulary and rephrase your descriptions per the changing user vocabulary.
- Adding high-quality visuals is a productive yet resource-intensive task. It’s a cost. Use analytics to identify key articles that need better examples.
- Use analytics to prioritize and serve cards that have specific content offerings. Offer these cards in the context of user actions, such as getting started, tip of the day, in-pane help, and quality tutorials around actions a user has performed on the software.
- Use analytics to identify and develop user profiles. Identify users’ needs, priorities, overall interaction and activities with the product, specific interests, and feedback. Identify the current tasks performed by users and predict what else can be performed. Balance mass user segmentation with specific personal user needs to serve optimized content. Invest in a continuous cycle where you use analytics to create hypotheses, and then use analytics to improve content. Next, fine-tune content to serve business rules. Depending on results, scale up profitable investments where user satisfaction and the success increases, and revisit failed projects where hypotheses could not be validated and success criteria stayed elusive.
Analytics is a resource-balancing, skill-balancing, and noise-balancing tool
All people in a big team are not equal. Each may bring different specializations and different skills. Each may have their unique weaknesses. To the external world, a chain is as strong as its weakest links. For horizontal specializations like technical communication teams, this rings true even louder. Smart use of analytics can feed various skills—customer examples that add relevance, instances of failed recall of concepts that point to visual improvement opportunities, customer confusions that share SME-optimizing needs, search-term spread that can help you reflect on information architecture, and specific questions that feed FAQ or troubleshooting doc queues. You can understand the “mass ask” and “class ask” and use them to assign tasks to the right set of people. Also, since customer asks are quantifiable, you can set, review, mentor, and audit processes for your team, such that even newbies or trainees can write without compromising on the quality. The intelligent use of analytics can provide team managers the opportunity to reorganize teams across workable units of excellence with complementary skillsets and a balanced experience range to deliver the quality — while maintaining essential levels of quantity.
Analytics is a navigation and search improvement tool
It is always difficult to organize content on the main landing page (index or hub page). Use analytics to identify consumption patterns. Identify which navigation paths work best for what content. Balance all-time popular content and essential content on hub pages. Rotate essential content that gets less page views on the hub page. Use analytics to optimize two-pane or three-pane views. Use analytics to allow dynamism or card placement. Similarly, use analytics to find the important queries that bring results to a page. Identify queries that have no results, conflicting results, or too many results. Normalize and optimize content for them. Direct search terms should directly take to the final consumed page and intermediary pages should be removed. Analytics and bots can help you make query-article clusters, identify user DSAT on queries, and filter clusters for specific queries or subqueries.
Analytics is an auditor
You can build downstream bots that can catch frequent errors, such as link breaks, circular links, blank spaces, spelling errors, missing images, branding issues, and so on. Analytics can be used to audit before-after gains in content improvements on major articles. Analytics can help you cross-validate. For example, do you have articles that talk a lot about payment but do not cover the key query that the customers have about using their credit cards?
Analytics as a structured input provider to product teams and customer experience teams
Content consumption provides significant data that can help product managers validate their decisions or get fresh insights into decision making. Popular articles have a direct correlation with popular features. New feature adoption ratio can be indirectly measured by incremental demands on that content. Effective use of analytics can identify use cases that can help improve the product. For example, the team can analyze the customer vocabulary to improve UI strings, workspace and workflow design, and in-product search. Analytics can also help discover disappointments that help in bug fixes, and in monthly/quarterly release planning. Analytics can provide user data that can help in making workflow test cases. Analytics can also provide input to the creation of structured assets to sell a product usage story. Analytics can identify tacit knowledge that exists but is not documented, is not consistently documented, or is documented in different and often conflicting ways. Analytics can also identify the subject matter experts that can help improve such tacit documentation.
Analytics identifies new users and users at retention risk
Smarter implementation of analytics can help your firm identify unique asks of new users. Analytics-triggered content can help users make purchase decisions. New users need to become comfortable with the product to use it longer to enrich and simplify their work and life. Analytics can help provide customized learning paths and intervention/test points to these users. Similarly, analytics can find users who are disappointed and on the verge of deciding to discontinue their use of the product or service. Such users can be custom-served by trained retention specialists and brought back to trusting folds with personalized intervention in the virtual and physical worlds.
Suggested metrics for content improvement through quality analytics
Analytics presents a blue-ocean opportunity to improve content. As you start using analytics intelligently, you will find your own measures. Once you have established a good practice, you can set up meaningful metrics for content success, user success, and product success—all fed through content analytics.
Content metrics
Here are some examples of the kind of metrics and metrics-based goals you can use for measuring continuous content improvement. Identifying your metrics and goals upfront also helps you in setting up systems, processes, and audit mechanisms to measure and act on the most important information.
| Measurement/Analytics | Possible Actions | Possible KPIs |
| Measure high-density negative comments on popular articles and improve the positive comments ratio in these articles. | Preparatory steps:
|
|
| Improve the overall quality of search results for premium content. |
|
|
| Improve the overall quality of navigation. |
|
|
User success
You can also set up task-based metrics on non-measurable but impactful investments that can improve user experience and user success. Here are some suggestions:
- Mirror customer language and expectations. Make structured improvements in top 5% popular content (as measured by page views) such that you incorporate fixed number of customer phrases (as analyzed from search queries and user verbatim) in your instructions. Based on the volume of feedback, you can change the number. Include at least 5 phrases for each popular article.
- Content consumption distribution: Define the consumption pattern and volume of content. Identify whether the content was consumed as downloads, visuals, or videos. Determine how many users have accessed and consumed the content. To analyze the content consumption, measure downloads, page views and unique visits, time spent, heat map data, user comments, user rating, and CTR.
- List popular questions. Create a set of frequently asked questions that answer top 10% popular phrases in search queries and user comments.
- Improve users’ cognitive understanding of products. Ensure SEO descriptions use phrases of popular concepts and tasks (as analyzed from search queries and user comments) with the features and capabilities of your products and solutions.
- Identify structured reinvestment candidates. List articles that have the maximum negative rating by users who spent more than a certain minimum time on the article. One way to establish a threshold is to eliminate page views of less than 15 seconds and set 50% of the time spent on the remaining articles as the threshold.
- Aid in content evangelization. Analyze the content evangelization patterns across social and other media channels. You can use this data to generate referral traffic, cause sales conversions, and build content awareness. Metrics will revolve around SEO-optimized content and user comment trends.
- Long-term user success through effective content would mean that existing or prospective users aren’t asking “Do I need something from content?” but “What more can content do to help me succeed?”
Sales/product quality
If you sell a subscription-based product or solution, you can set up some metrics to determine the quality of sales or products; these metrics can be triggered from content analytics. Here are some examples:
- Track the percentage of user comments that convey intent such as “I want to purchase”, “how do I renew”, and “where do I buy”, and serve those users. This information will also be useful for your organization’s sales, /advertising, and information channels.
- Reduce the percentage of user comments that indicate issues with payment: “credit card”, “payment failure”, “can’t pay”, “can’t purchase”, and similar expressions.
- Reduce the percentage of user comments that indicate that a functionality does not work as intended. Establish a distinction between “wish list” and “fix list” here, and focus on the “fix list”.
- Reduce the percentage of user comments that include words such as “cancel”, “refund”, “money-back”, and “fraud”. By fixing these issues, you can reduce the churn rate and defection to competitors, and thereby increase overall satisfaction and retention.
- Build an error dictionary using analytics. Make the error dictionary contextually available from the product. Improve troubleshooting content by detailing issues and solutions that hinder user’s productivity. Use analytics to improve product functionality. Eliminate or fix maximum error-causing situations.
2020s is the twenty-second century: Are you prepared?
The use of analytics and its extension in machine language learning and in deep learning algorithms will change every process involved in creating content. These challenges have been evident to all content-for-profit vendors for a while; technical communicators too cannot ignore these trends anymore. Winners of tomorrow will be those who can sense the changing customer experience, interaction, demand, and pulse at the tap of a button and organize their entire content creation, review, publishing, and measurement processes using analytics. Winners of tomorrow will collect data from all unstructured sources to feed common analytics. They will use meaningful hypotheses that define business rules required to personalize offering to serve each user individually, productively, and satisfactorily!
It’s a deep ocean there, and we need to learn to fly init to avoid drowning in the increasingly toxic air above! This is also the time to build a niche in just about any profession, including our own, that we put our mind whole heartedly to. May the Force be with the best prepared!
About the Author
Pawan Nayar works as Director, Content and Community at Adobe Systems. An alumnus of MIT Sloan School of Management, Pawan marries his two passions—content creation and research in the domain of deep learning of words and their interpretation and consumption—to create analytics-driven content for exceptional products, and shape technologies for productive and profitable content creation.
Special thanks to Shaleen Gupta for creating the supporting visuals. Shaleen Gupta works as an Experience Designer for content. Shaleen has a love for visualization, user experience, and experience design. He uses these interests to enhance users’ navigation, search, and cognitive understanding needs.
A very well written perspective. Gives a lot of insights on current challenges and cues for adaptation.