This is the second essay of a three-part series. Read part 1 here.
In the previous article we talked about preparing the Rich Content Outline. In this article we are going to talk about the Ratio Analysis.
Ratio Analysis
The concept of ration analysis is popular in accounting and finance. The accountants apply some ratios to the numbers they have and try to predict the fiscal condition of the organization.
I have tried to apply the same principle to Technical Writing. I think Ration Analysis:
- Is generic enough to be applied to any type of document (independent of product, technology, deliverable format, delivery mode, and so on…).
- Helps to identify problems in the document’s organization.
- Helps to correct problems in document organization even before the document is written.
Before we go ahead and understand the rations. Let’s see what we are going to apply them to.
In the previous article we ended with a Rich Content Outline for the document. It looked something like this.
Notepad User Guide – Rich Content Outline
Chapter 1: Introduction to Notepad
Need of Word Editors
Information Organization Pattern: General to specific
Graphic: A person working on a computer
Table: None
Procedures: None
Cross-References: Advantages of Notepad
Advantages of Notepad
Information Organization Pattern: Most Important to least important
Graphic: None
Table: None
Procedures: None
Cross-References: Limitations of Notepad
Limitations of Notepad
Information Organization Pattern: Most Important to least important
Cross-References: Advantages of Notepad
Types of files Notepad can be used to edit
Information Organization Pattern: List sorted by well-known to least-known
Cross-References: URLs of resources related to Notepad on Internet
Comment: Mention about Notepad 2007 (The XML editor)
Chapter 2: Getting Started with Notepad
Starting Notepad
Information Organization Pattern: Whole to parts
Graphic: Notepad Window with callouts showing Menu Bar, and Text
Table: Menu Description
Procedures: Starting Notepad from Programs File
Cross-References: Closing Notepad
Now, let’s first generate some numbers here. For every topic that you see in the RCO try to predict the number of pages it is going to take. For the sake of estimation assume that we are talking about a standard A4 size page with 10 pt Times New Roman used for body text.
So, let’s look at Chapter 1: Introduction to Notepad. Let’s estimate pages for every topic based on the information contained in it.
Need of Word Editors (1 page)
Information Organization Pattern: General to specific
Graphic: A person working on a computer
Table: None
Procedures: None
Cross-References: Advantages of Notepad
Advantages of Notepad (1/2 page)
Information Organization Pattern: Most Important to least important
Graphic: None
Table: None
Procedures: None
Cross-References: Limitations of Notepad
Limitations of Notepad (1/2 page)
Information Organization Pattern: Most Important to least important
Cross-References: Advantages of Notepad
Types of files Notepad can be used to edit (1/2 page)
Information Organization Pattern: List sorted by well-known to least-known
Cross-References: URLs of resources related to Notepad on Internet
Comment: Mention about Notepad 2007 (The XML editor)
So, for Chapter 1 we will have a total of 1 + ½ + ½ + ½ = 2 ½ pages. Since ½ page is not practical, let’s round off the total to 3 pages.
Follow these steps and put down the number for every chapter you have in your RCO.
This may give you a table like this.
| Chapter | Number of Pages |
| Chapter 1 | 3 |
| Chapter 2 | 10 |
| Chapter 3 | 15 |
| Chapter 4 | 32 |
| Chapter 5 | 22 |
| Chapter 6 | 4 |
| Chapter 7 | 6 |
| Chapter 8 | 12 |
| Chapter 9 | 5 |
| Chapter 10 | 6 |
| Total pages in document | 115 |
So now we have some numbers ready. We can start with the Ratio Analysis here. Let’s also calculate the ratios using these numbers and see what we get.
I have conceptualized three ratios. The ratios are named after three technical writers who came together to create India’s first University Recognized Post-Graduate Diploma in Technical Communication Course. These would be Frederick Menezes, Sunil Gokhale, and the author of this article Makarand (Mak) Pandit.
What are these ratios?
Ratio 1: Frederick Ratio or Height Ratio
Ratio 2: Sunil Ratio or Width Ratio
Ratio 3: Mak Ratio or Distribution Ratio
Frederick Ratio
FR = Number of pages of the biggest chapter/ Number of pages of 2nd smallest chapter
- This ratio indicates the difference between the biggest and the smallest chapter.
- This ratio by definition will not be less than 1.
- Ideally this ratio should be in the range of 5 to 7.
- It should not be more than 10 in any case.
Example of Frederick Ratio
With reference to the numbers given above, let’s calculate FR.
Pages of biggest chapter, Chapter 4, are 32 and that of the 2nd smallest chapter are 4, then
Frederick Ratio = 32/4 = 8
Note: The reason I do not consider the smallest chapter is for exceptional reasons the document may contain a chapter that is only 1 or 2 pages (for example Quick Reference Chart, Installation procedure, and so on.) If this is the case, considering that number for calculations will give misguiding readings. If you are sure that this is not the case feel free to use the pages of the smallest chapter for calculating FR.
Observations: Frederick Ratio or Height Ratio
- Ideally value of FR should be in the range of 5 to 7. In our given example, it is 8. Which is not very good.
- If it is more than 10, it means the biggest chapter has ten times the pages than the 2nd smallest chapter.
- If the ratio is 1, it means all the chapters in the book are equal.
- Note that we do not take the smallest chapter. For exceptional reasons there could be a smallest chapter of only 1 or 2 pages (for example, Quick Reference or Installation.)
Sunil Ratio or Width Ratio
SR = (Number of pages of biggest chapter / Number of pages in the Book) x 100%
This ratio indicates what amount of the content lies in one chapter. This ratio by definition will be less than 1.
So we consider it as a %.
Ideally this ratio should be in the range of 10 to 20%.
It should not be more than 30% in any case.
Example of Sunil Ratio
With reference to the numbers given above, let’s calculate SR.
Pages of the biggest chapter are 32 and total pages in the book are 115, then
Sunil Ratio = 32/115 = 27.8%
Observations: Sunil Ratio or Width Ratio
- Ideally this ratio should be in the range of 10 to 20%. In our example it is almost 28%
- If it is more than 25%, it means one fourth of the book is contained in one chapter.
- This will make the information in that chapter difficult to find.
Let’s look at the third ratio now.
Mak Ratio or Distribution Ratio
MR = Number of pages in the book / Number of chapters
This ratio indicates how well the chapters are distributed.
Ideally this ratio should be in the range of 15 to 40.
Example of Mak Ratio
With reference to the numbers given above, let’s calculate MR.
Total pages in a book are 115 and total chapters are 10.
Mak Ratio = 115/10 = 11.5
Observations: Mak Ratio or Distribution Ratio
- Ideally value of MR should be in the range of 15 to 40.
- If the value is less than 15, it means you have distributed the book into too many chapters. There is a scope of to combine some of them. Or you can consider reorganizing the entire document. This seems to be the case with our example. On an average we have only 11 pages per chapter.
- If the value is more than 50, that means number of pages could be too high. So some chapters can be split.
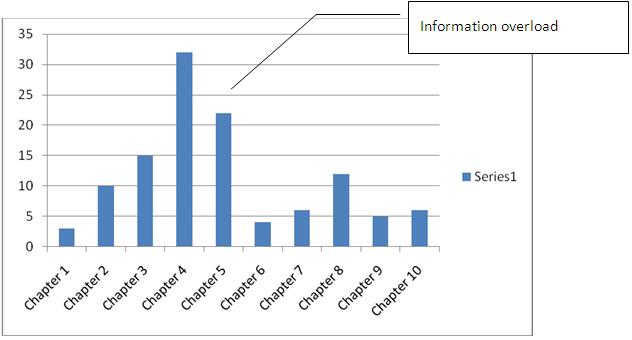
Many interesting readings can be made if you plot a graph of the number of pages and chapter. For example, look at the graph below. It is drawn for the numbers considered in the example. You can clearly see that the information distribution is very poor in this document. There is information overload in Chapter 4. This gives rise to pyramid structure. This means the readers will be overloaded with information in Chapter 4 and get very little information in 1, 2, 6, and 7.
Poor Document Organization
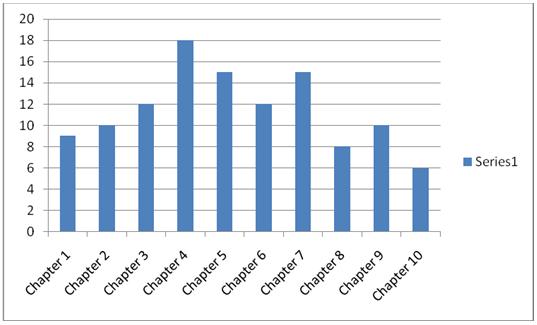
I have found that many times new writers create document structures like this. The situation can be improved by changing the document structure and making it more flat. The figure given below indicates much better document organization for the same number of pages with much better rations.
Better Document Organization
Some more thoughts on Ratio Analysis
- The values of FR, SR, and MR, can change depending on type of document.
- The value of MR could vary a lot for different types of documents. MR becomes more significant in bulky documents.
- Some interesting observations could come up if you apply them to your existing documents. You can study any five manuals you already have and apply the three ratios to them. See what you get.
- The combination of these ratios may give some unique observations.
If you do any more work on this, please be in touch. I would like to know how this idea can be developed further.
About the author:
Makarand (Mak) Pandit is a technical communicator/trainer with over 17 years of experience. Mak runs a Technical Writing & Training Company – Technowrites Pvt. Ltd. Mak can be reached at mak@technowrites.com.
About the illustration:
Used with permission from Mallika Yelandur.


Very useful article..